CLTI · Limb, life & the continuing patient population
Start with the
published CLTI range.
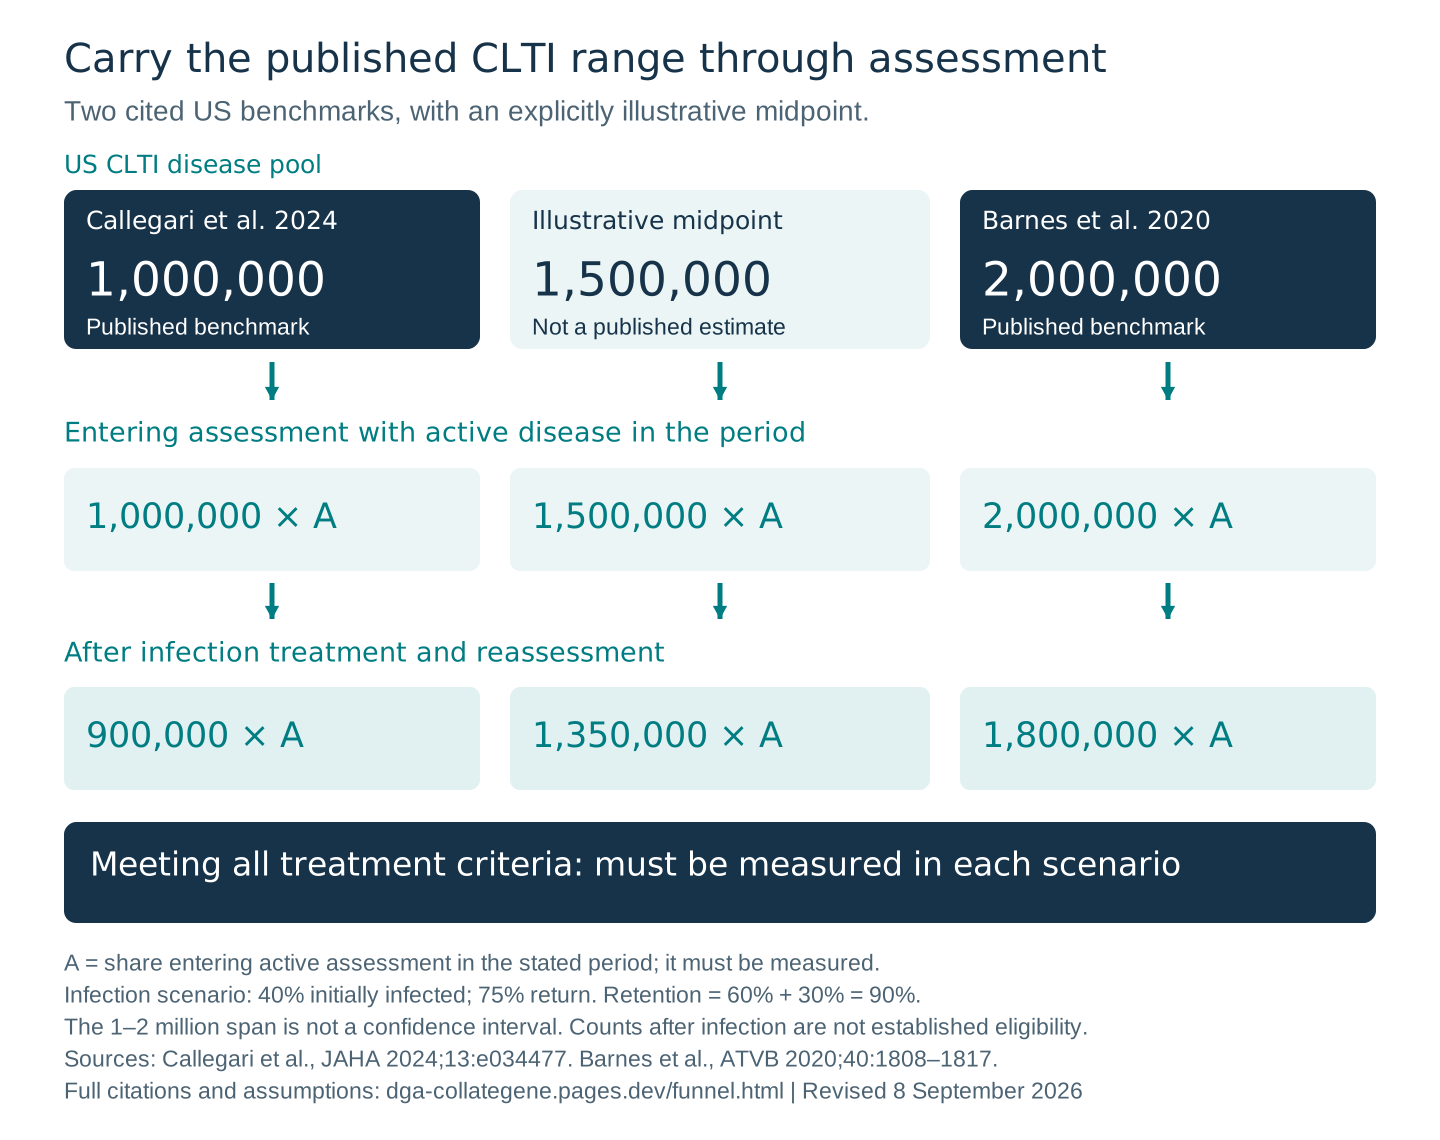
Callegari et al. cite approximately 1 million US patients with CLTI. Barnes et al. summarize approximately 2 million adults over 40. Carry both estimates through the model, with their sources and assumptions visible.
Infections can resolve.
Chronic ischemic disease and wound risk can persist, progress and recur.
Evidence update · 8 September 2026
The revised starting range
Show both published estimates.
Carry each one forward.
Cited in the epidemiologic introduction of a prognostic study after peripheral vascular intervention. This is background synthesis, not a new national prevalence survey.
Read the manuscript ↗Barnes et al. · ATVB 2020~2 millionUS adults over 40 with CLTIThe review reports 1.28% prevalence in adults over 40, approximately 2 million people, citing Duff et al. 2019.
Read the manuscript ↗The 1–2 million span brings together these two published CLTI benchmarks. 1.5 million is an illustrative midpoint, not a third study estimate. Differences in source year, age, coding and clinical definition need reconciliation; the span is not a confidence interval or harmonized national prevalence estimate.
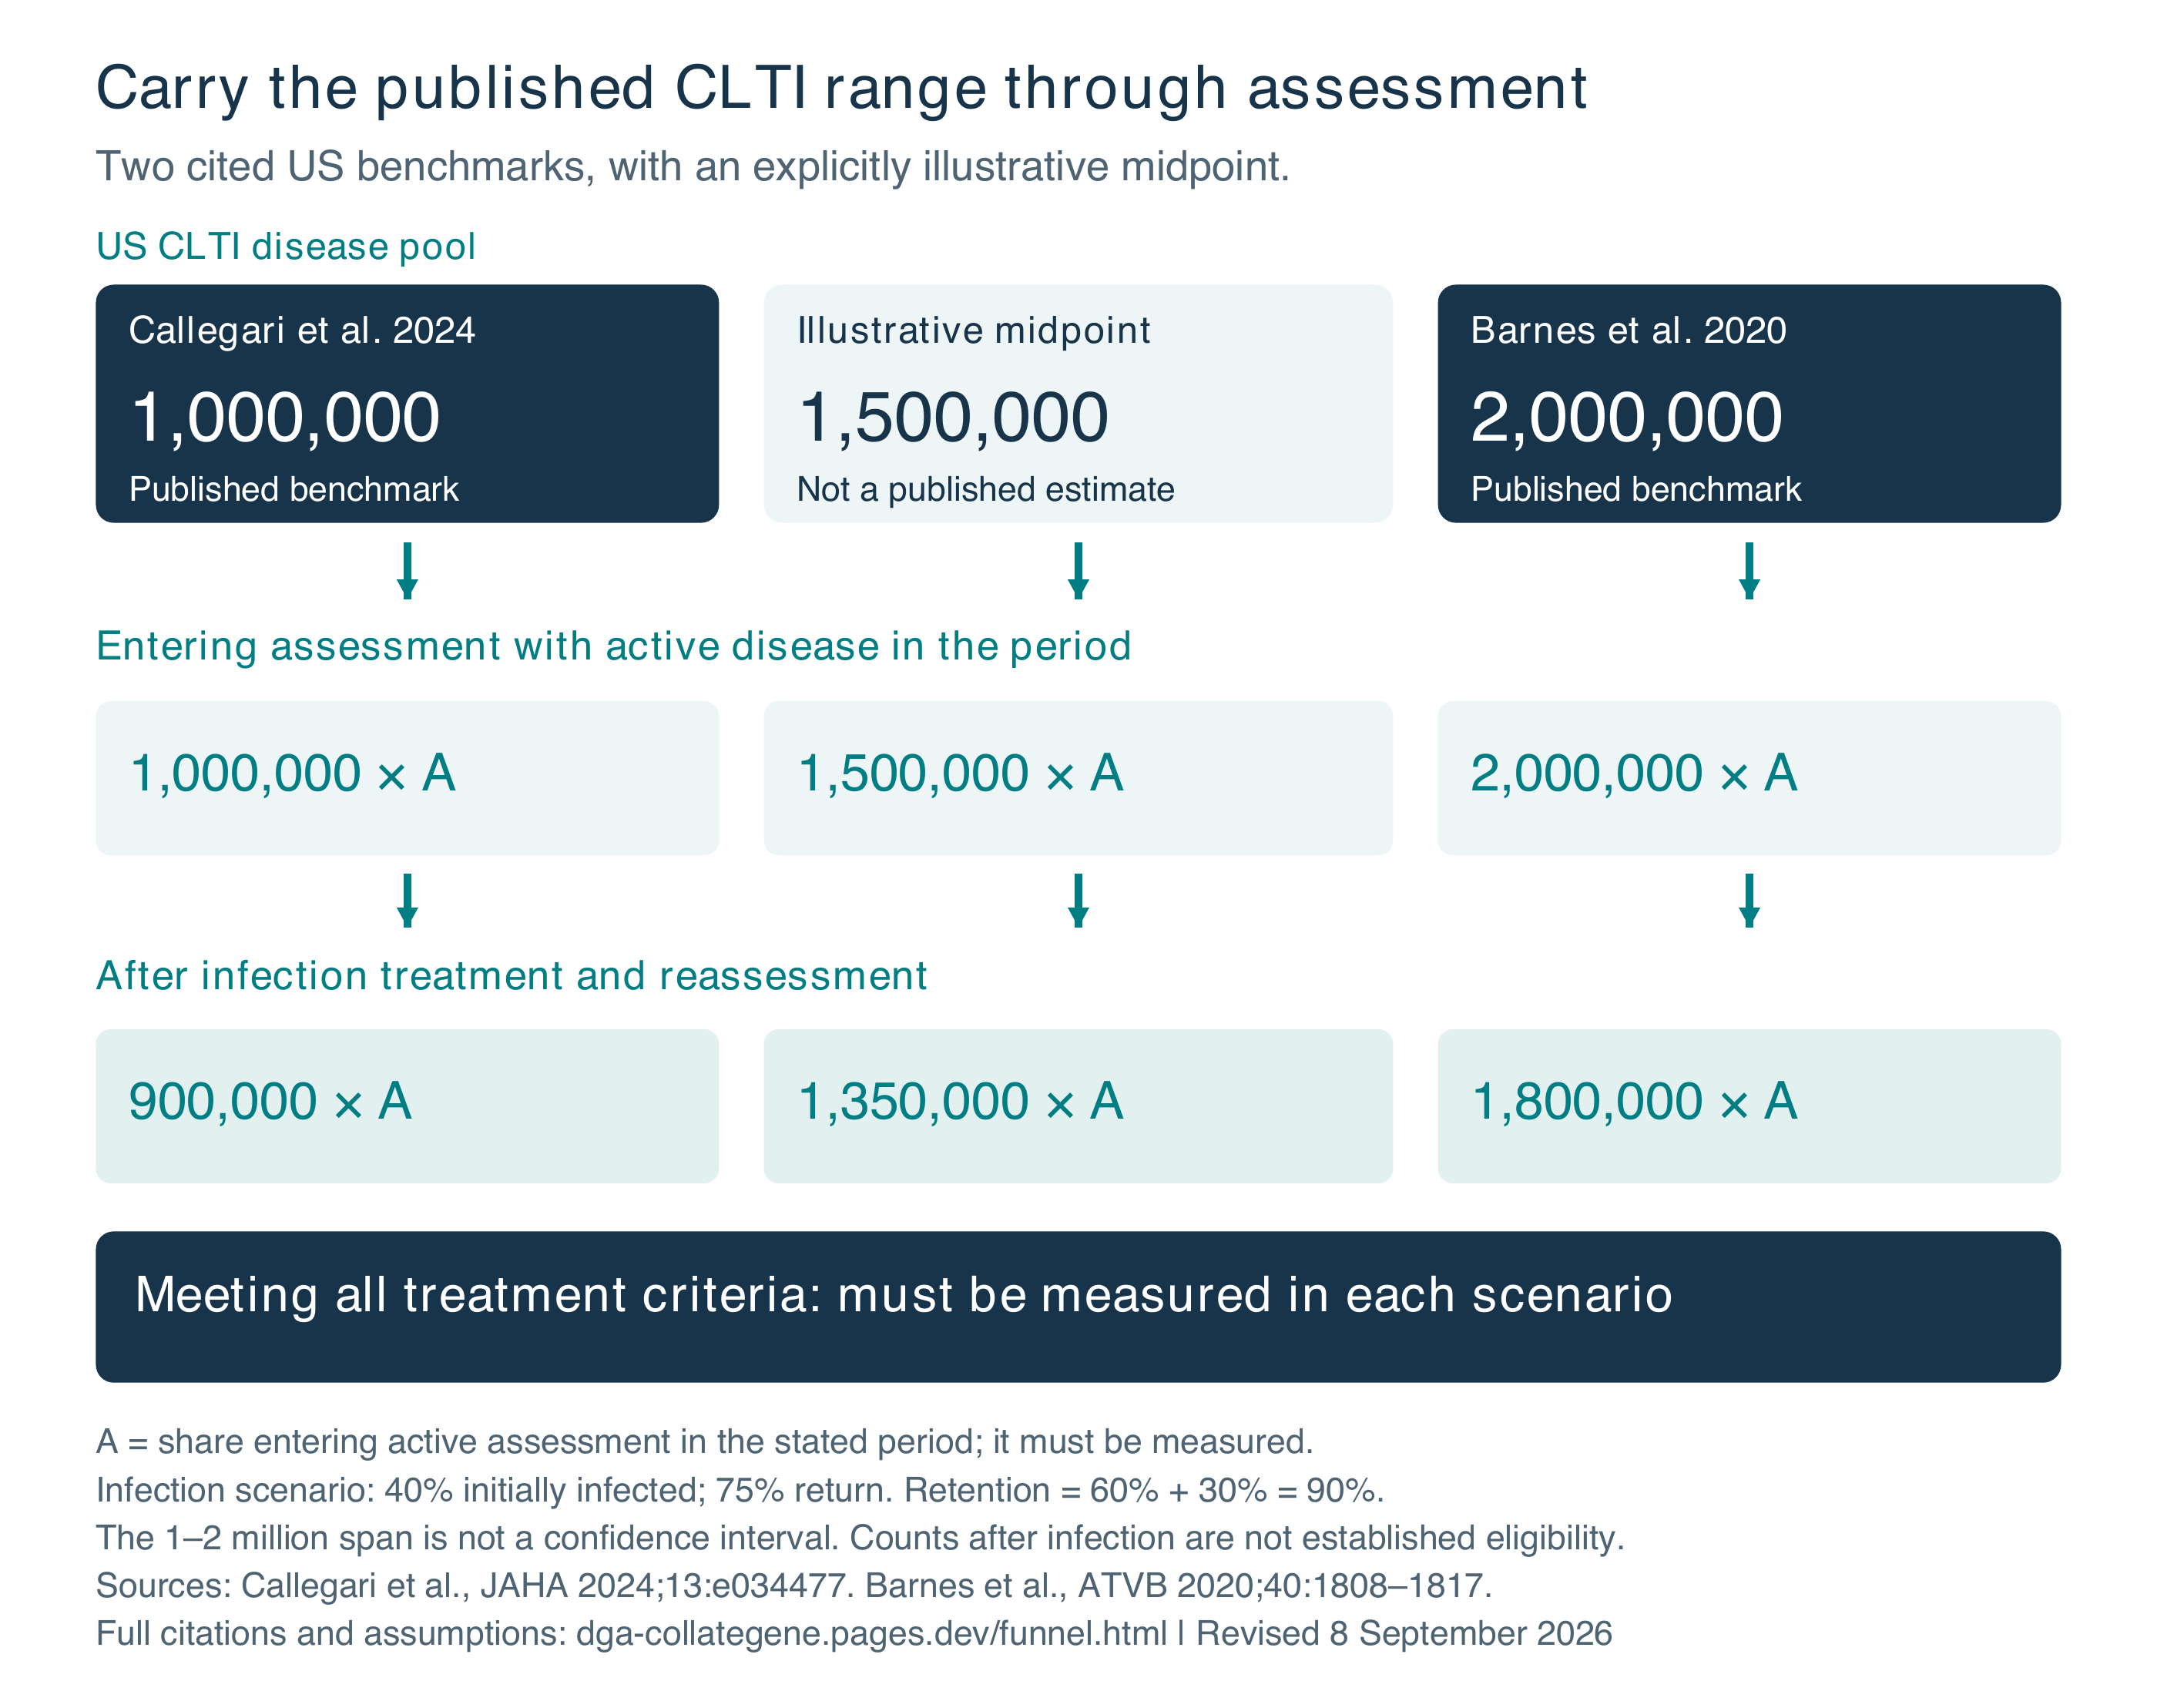
| Assessment pathway | Callegari 2024 1.0M benchmark | 1.5M midpoint Illustrative only | Barnes 2020 2.0M benchmark |
|---|---|---|---|
| US CLTI disease pool | 1,000,000 | 1,500,000 | 2,000,000 |
| Entering active assessment | 1,000,000 × A | 1,500,000 × A | 2,000,000 × A |
| After provisional infection step | 900,000 × A | 1,350,000 × A | 1,800,000 × A |
| Meeting all treatment criteria | Must be measured | Must be measured | Must be measured |
A is the share entering assessment with active disease in the stated period and must be measured. The provisional infection scenario retains 90%: 60% initially without infection + 40% initially infected × 75% returning. These are people remaining for further assessment, not established treatment candidates.
Harmonize each source to IQVIA’s age-50-and-older target before estimating annual assessment or treatment. A disease pool, annual first diagnoses and the number treated in a year are distinct measures.
The third manuscript · broader PAD context
Deng et al. 2025
16.41 million people with PAD in high-income North America in 2021 (95% uncertainty interval 14.68–18.34 million), projected to 31.08 million in 2050. These are GBD-based regional PAD estimates.
This is not a third US CLTI estimate. The regional total is not the US total. The “up to 11%” PAD-to-CLTI statement in the CLTI literature cannot be applied to it to establish national CLTI prevalence or an annual transition rate.
Read Deng et al. · Research 2025 · Table 1 ↗Illustrative discussion scenario · 8 September 2026
The prevalence waterfall, with each assumption visible
The two published starting estimates follow the same percentages through infection reassessment, a provisional clinical eligibility deduction, prescribing and access. This illustration assumes the full disease pool enters assessment over time. These are not annual treatment forecasts.
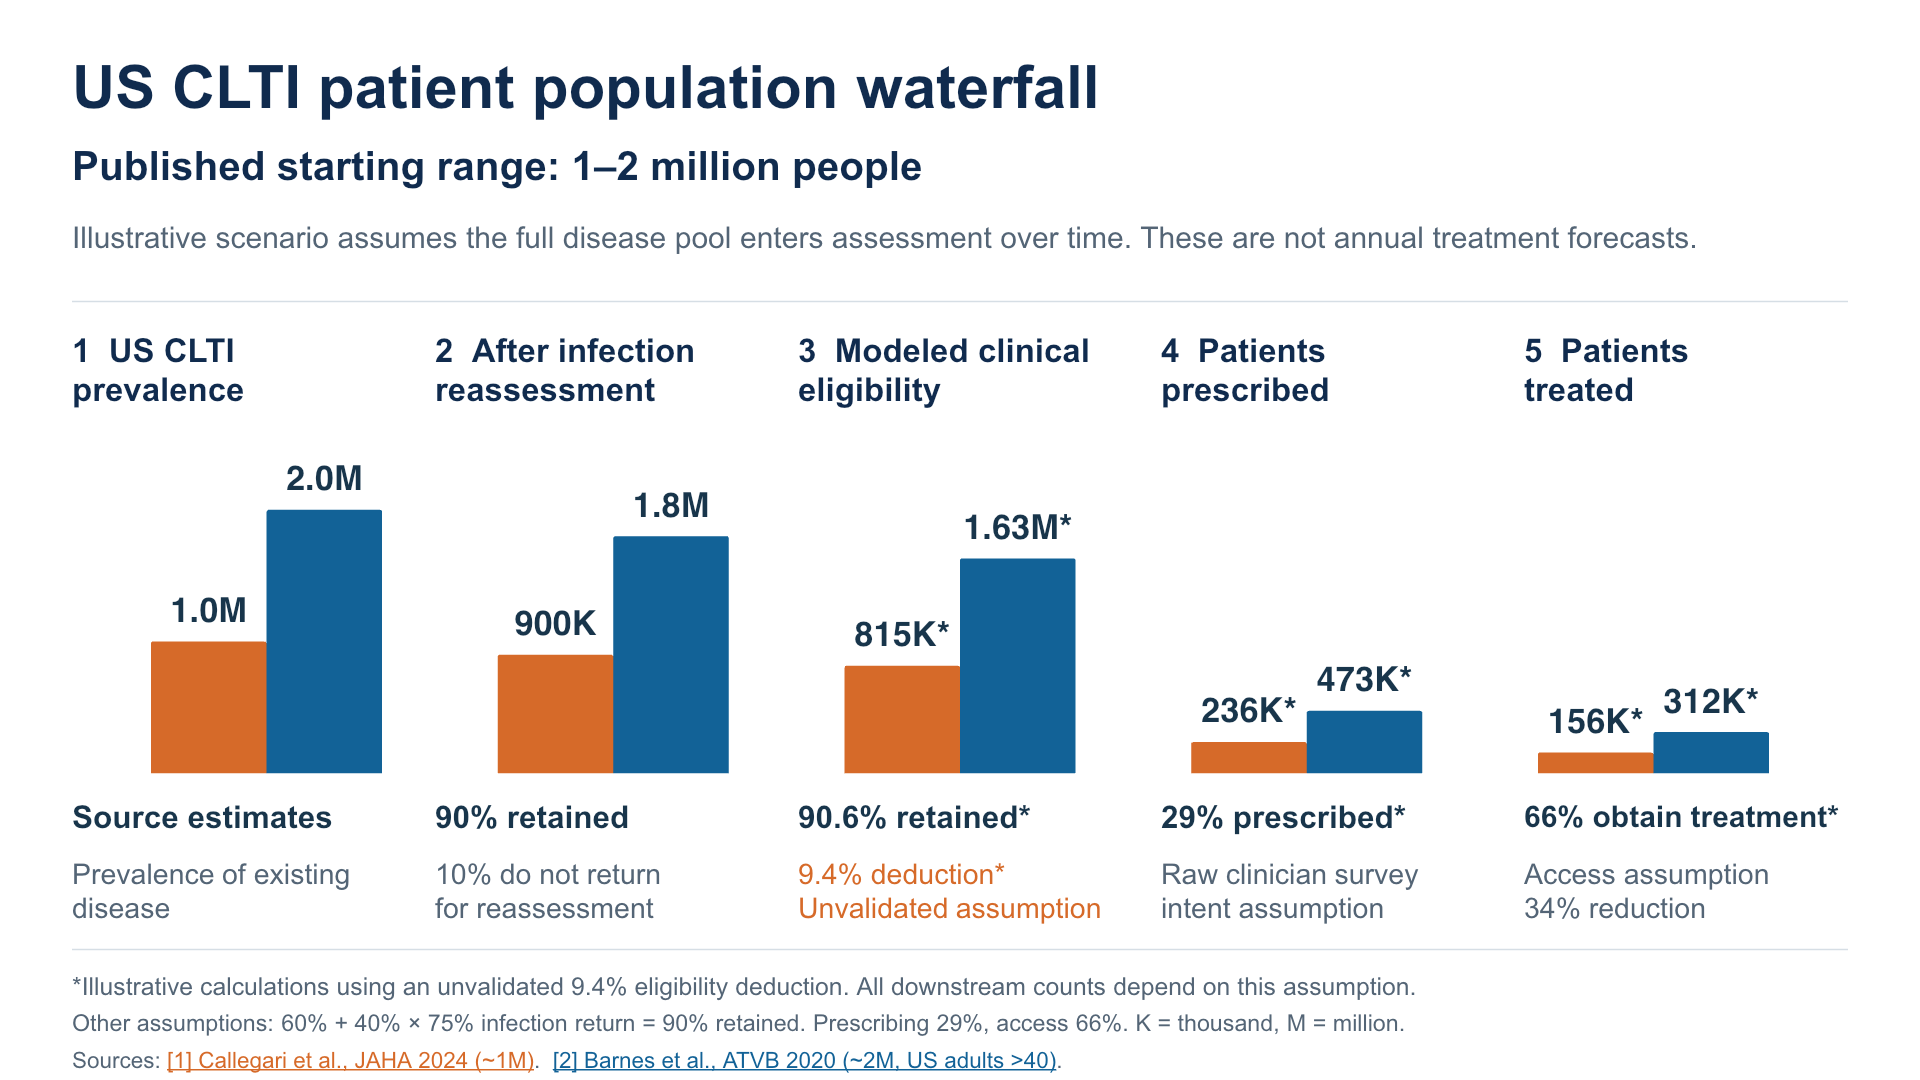
| Step | Callegari: 1 million | Barnes: 2 million |
|---|---|---|
| Published US CLTI prevalence | 1,000,000 | 2,000,000 |
| After infection reassessment: 90% retained | 900,000 | 1,800,000 |
| Modeled clinical eligibility: 90.6% retained* | 815,400* | 1,630,800* |
| Prescribed: 29% of the preceding group* | 236,466* | 472,932* |
| Treated: 66% of the preceding group* | 156,068* | 312,135* |
*Illustrative calculations using an unvalidated 9.4% eligibility deduction. All downstream counts depend on this assumption. Retaining this scenario for discussion does not make the claims-based 9.4% finding a validated treatment exclusion rate. Clinical eligibility still requires individual assessment. The final row rounds to whole people.
Other assumptions: 60% initially without infection plus 40% initially infected × 75% returning after treatment gives 90% retained. The 29% prescribing and 66% access inputs come from the supplied baseline slide and also need validation. The source estimates have different dates and definitions and do not establish a 2038 age-50-and-older forecast.
Sources: Callegari et al., JAHA 2024 (~1 million) and Barnes et al., ATVB 2020 (~2 million, US adults over 40). Read the clinical eligibility evidence.
Limb and life are both at stake
CLTI carries a major
risk of death.
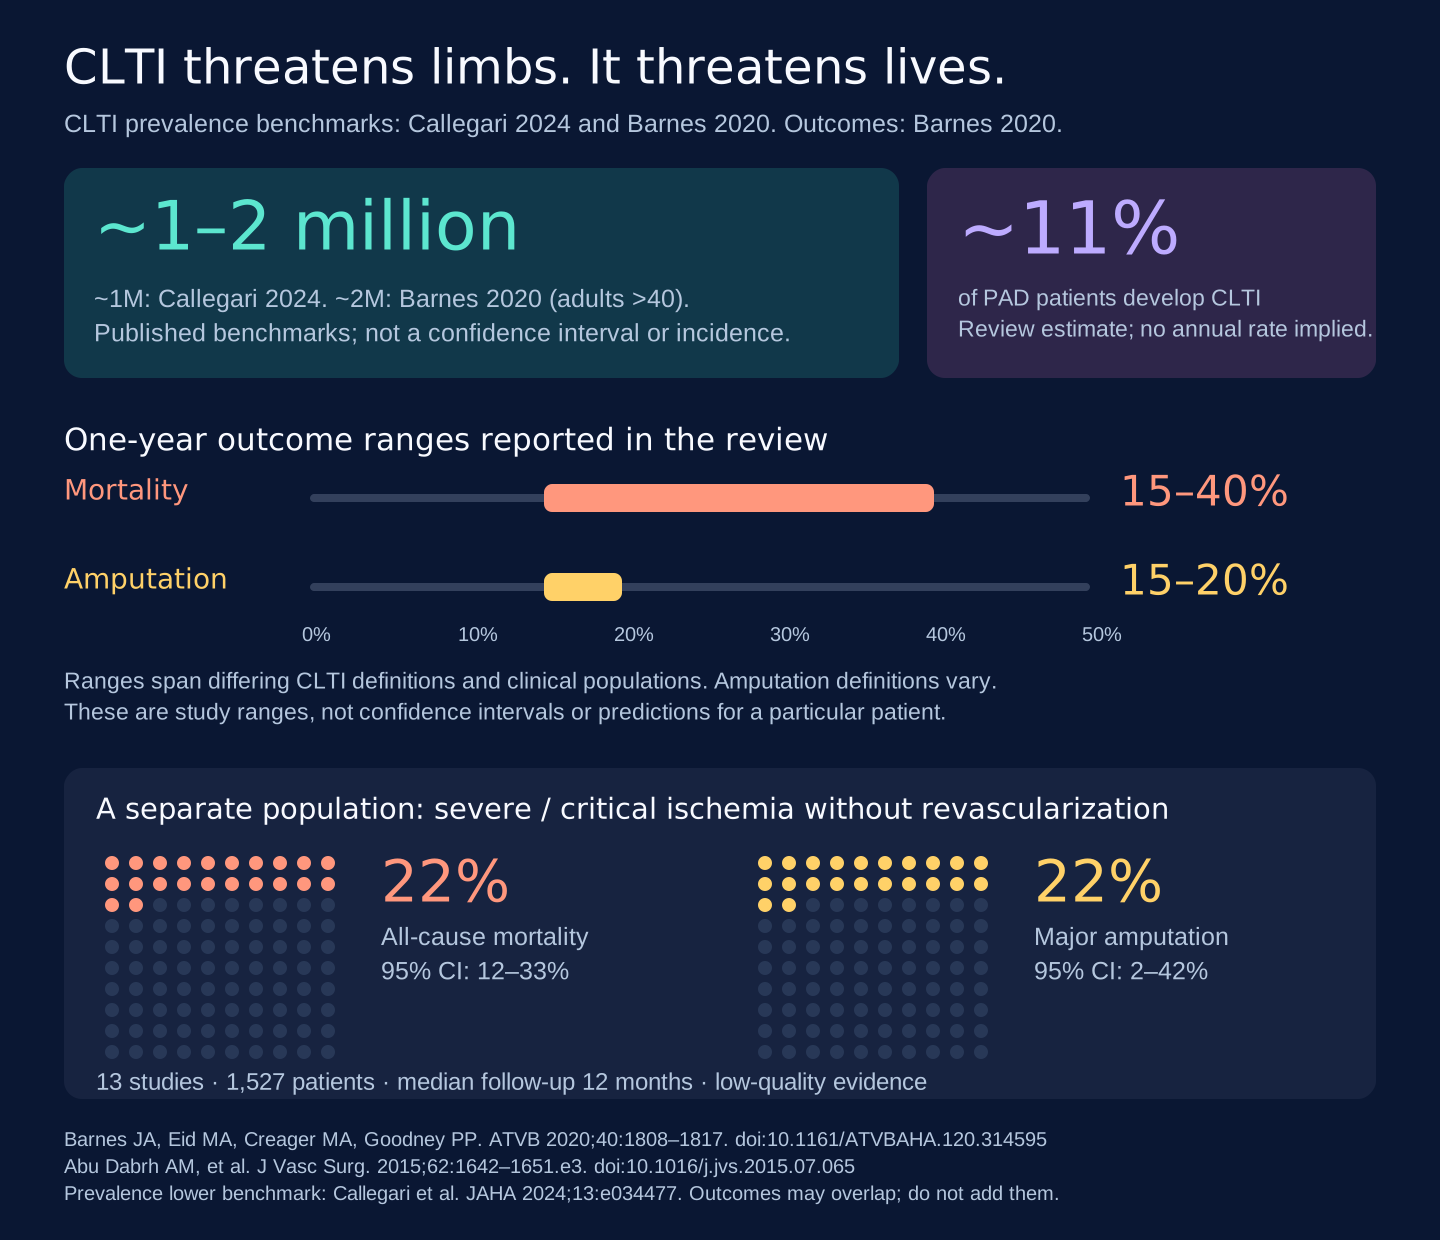
In their 2020 review, Barnes, Eid, Creager, and Goodney bring together the population burden and the consequences of CLTI. Each graphic below links to its source.
These are ranges across heterogeneous studies, not confidence intervals or an individual prognosis. The underlying Duff review includes different amputation definitions, treatments and follow-up methods. Mortality is not restricted to cardiovascular death. Read Duff et al. (2019)
A separate natural-history analysis
Severe / critical limb ischemia
without revascularization
Abu Dabrh et al. pooled 13 studies involving 1,527 patients, with a median follow-up of 12 months.
The authors rated the evidence low quality because of bias and inconsistency. These historical findings describe patients who did not undergo revascularization.
Mortality and amputation can overlap; the two 22% estimates must not be added. These data establish clinical urgency. They do not establish a survival benefit from CollateGene.
The central distinction
Infections are transient.
CLTI is permanent and progressive.
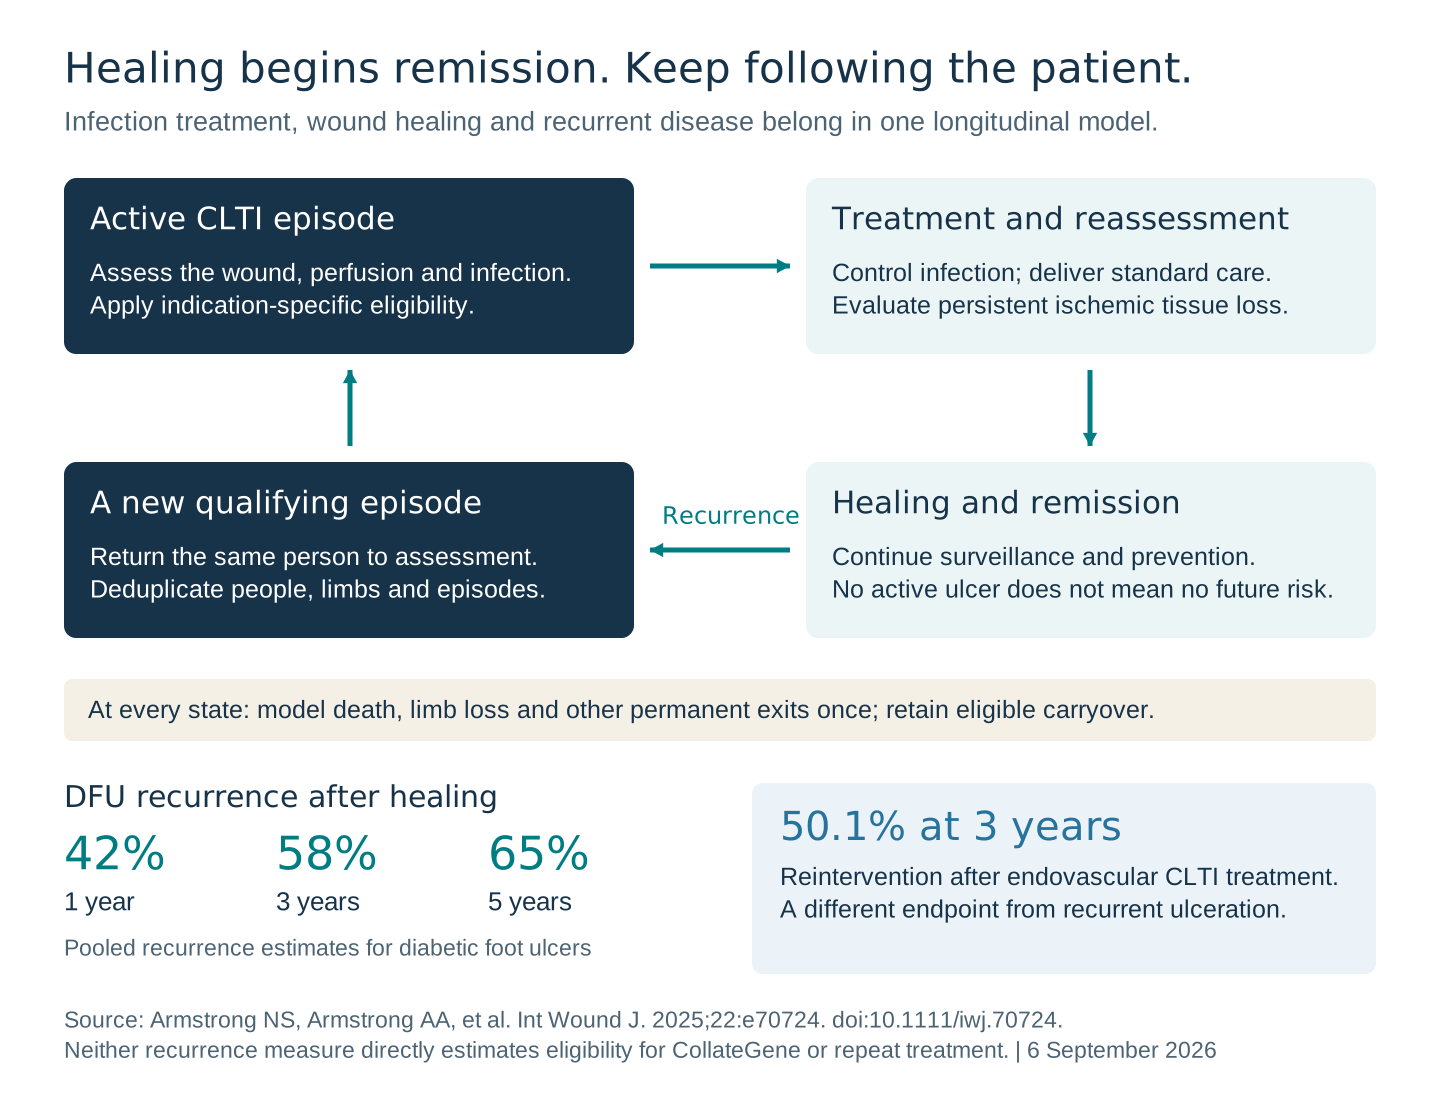
Treat the infection. Keep following the person.
Infections are often transient and treatable. Underlying ischemic disease and wound risk can persist, progress and recur. Individual CLTI episodes can improve, and wounds can heal into remission; those transitions belong in a continuing care model.
Infection → treatment
Control infection and reassess the limb, perfusion and indication.
IWGDF/IDSA guideline ↗02Healing → remission
Wound closure begins a period of surveillance and prevention.
Armstrong & Armstrong et al. ↗03Recurrence → reassessment
A new qualifying episode brings the same person back into care.
Read the recurrence manuscript ↗The cancer comparison concerns recurrence and sustained follow-up; it does not imply identical biology or treatment effects.
Assess the patient. Establish who qualifies.
Start with the cited 1–2 million CLTI benchmark range, identify who enters care with active disease, and preserve a route back after infection treatment. The graphic carries each endpoint and the illustrative midpoint through identical assumptions. Clinical eligibility must then be measured.
Infection is a clinical state
Treat. Reassess. Preserve a route back.
Keep the route back visible.
Illustrative planning scenario40% × 75% = 30% returning. An explicit assumption, not a measured CollateGene re-eligibility rate. Additional clinical criteria still apply.
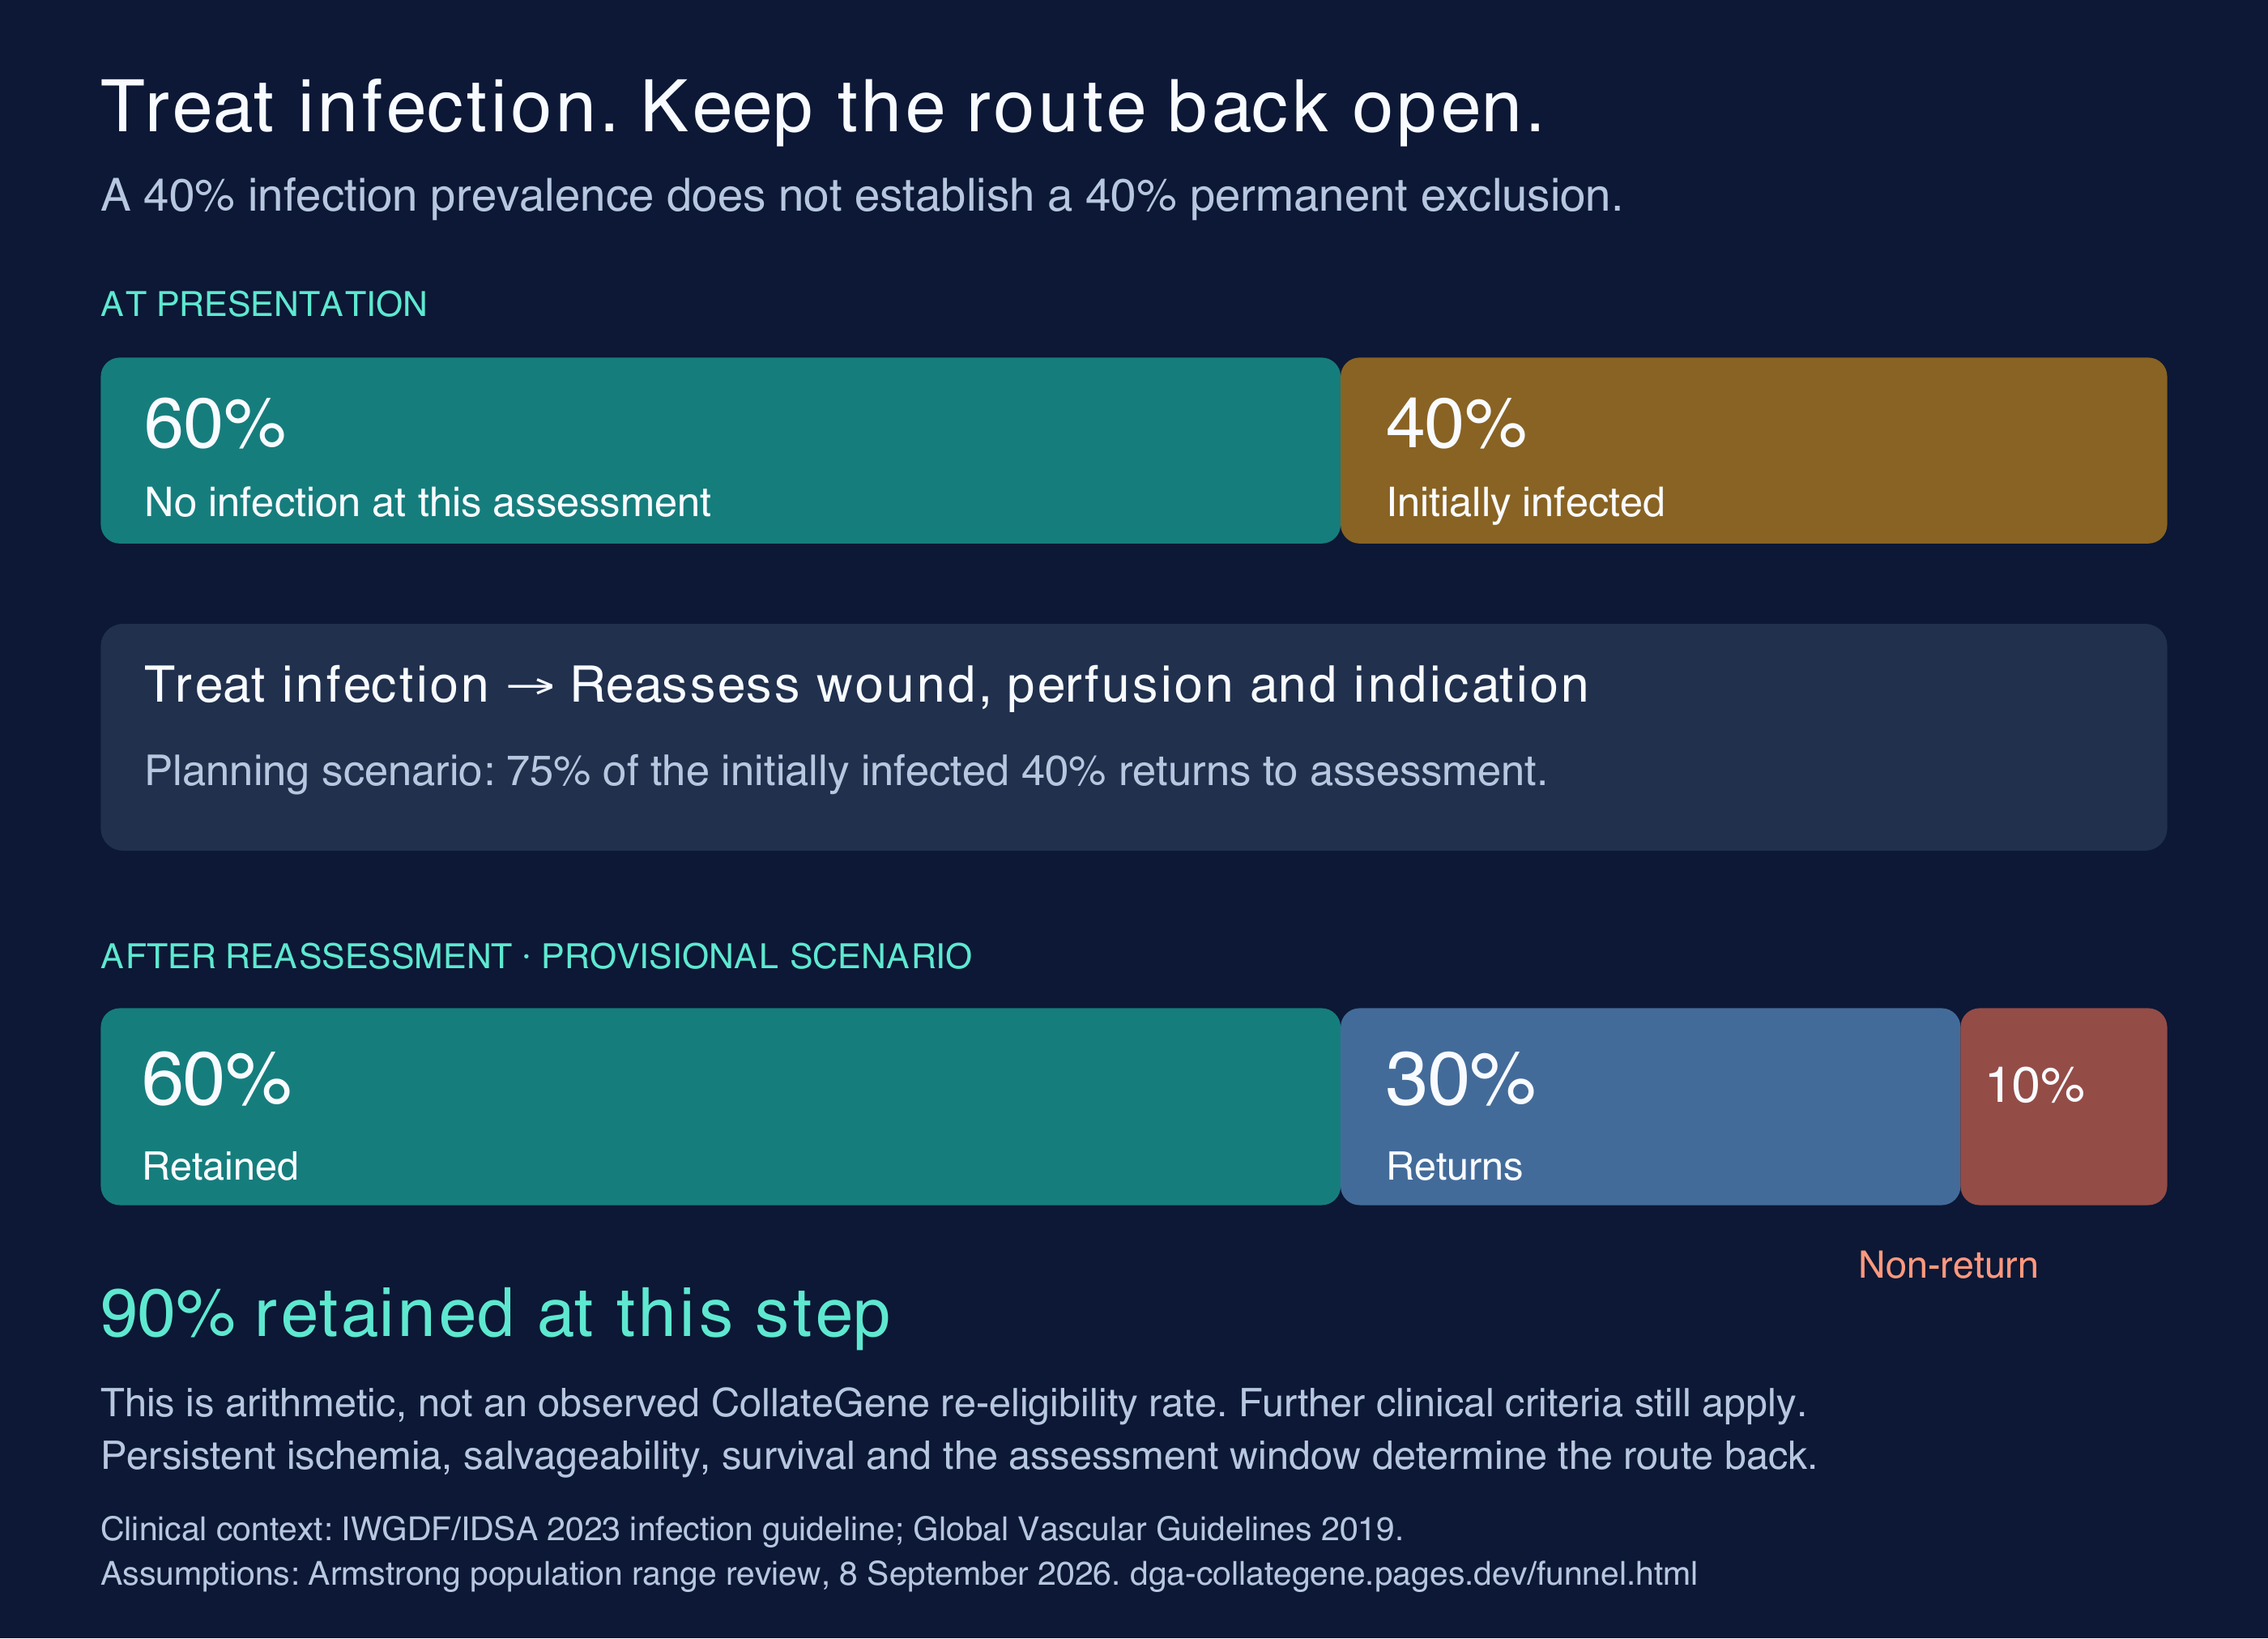
Read the model assumptions ↗A 40% infection prevalence at presentation does not establish a 40% permanent loss. If 75% of the initially infected group returns to assessment, the whole cohort retains 60% + (40% × 75%) = 90%.
Proposed scenario: 10% whole-cohort non-return. That means 25% of the initially infected group does not return at this step. It is a transparent planning assumption, not a measured rate of chronic untreatable infection.
The ADA monograph reports high infection resolution with appropriate care. Direct studies show more variable outcomes: Pham et al. observed 74.2% remission overall, while Altmann et al. observed 70.1% in revascularized ischemic DFI episodes. Infection remission is not equivalent to gene-therapy eligibility. ADA monograph · Pham 2022 · Altmann 2023
The relevant next question is whether the person remains alive, has a salvageable limb and still has a qualifying ischemic wound after treatment. Both infection guidance and vascular guidelines support integrated care and reassessment. IWGDF/IDSA · Global Vascular Guidelines
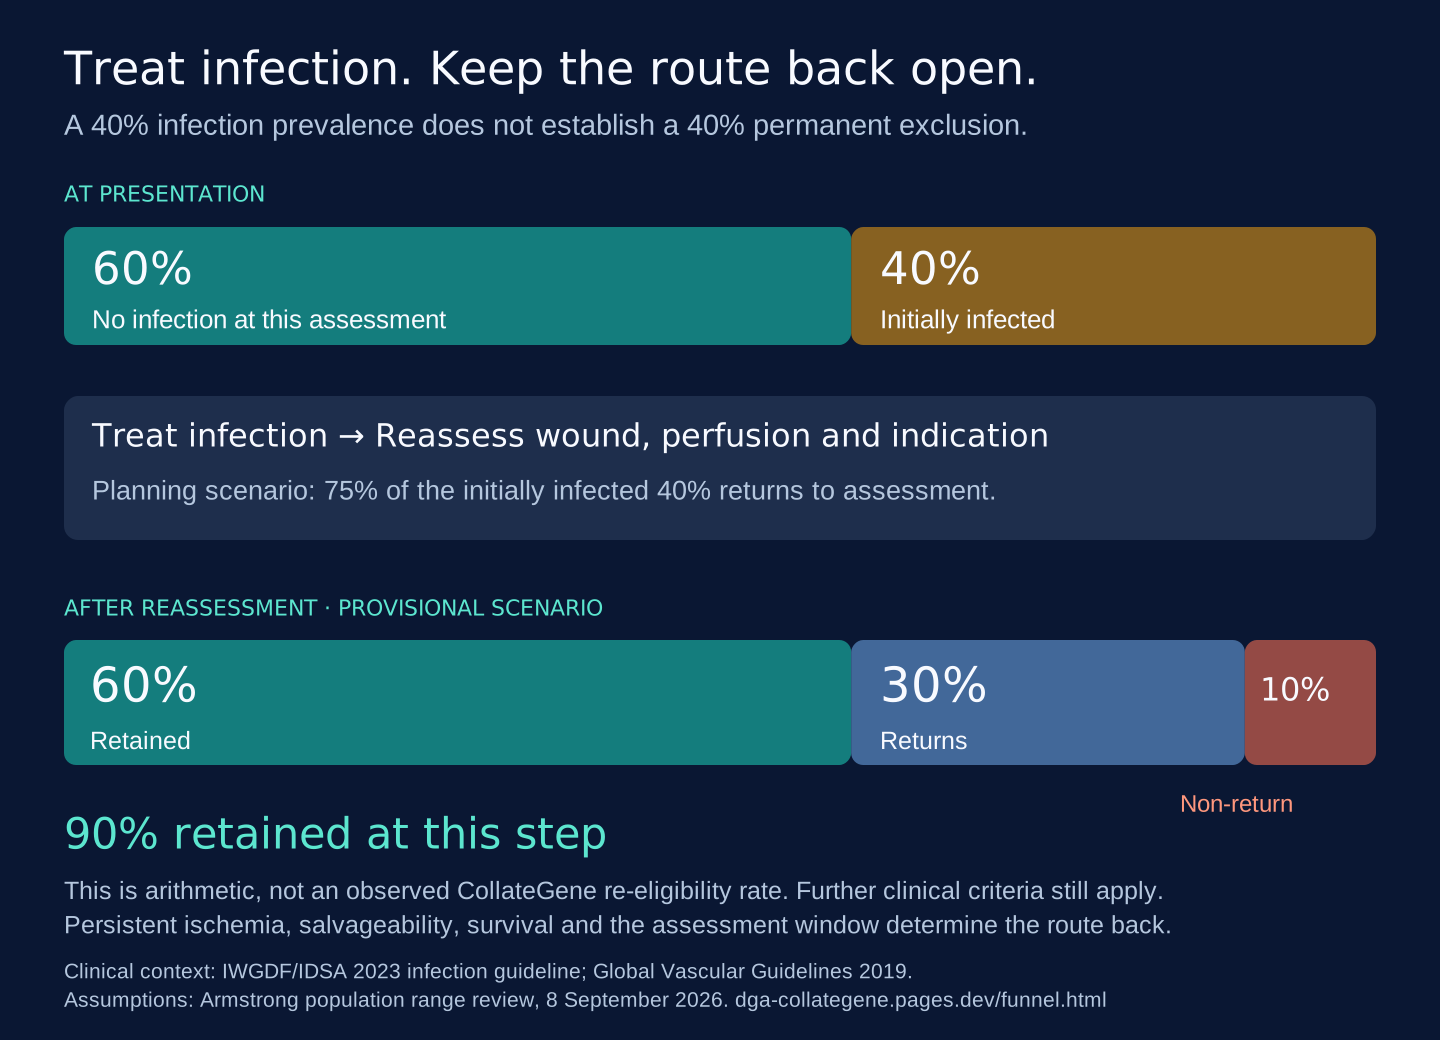
Across the cited range: the provisional 90% retention leaves 900,000 × A under Callegari’s 1.0M benchmark, 1,350,000 × A at the illustrative midpoint, and 1,800,000 × A under Barnes’s 2.0M benchmark. See the return-rate sensitivity table →
Some patients may be excluded for the wrong reason
Count patients by their actual clinical condition.
Do not exclude patients using CLIPPER’s 9.4%.
CLIPPER describes diagnosis-code categories. It does not measure who can receive CollateGene. The earlier 9.4% exclusion scenario, the 14.7% average derived from it, and the dependent patient projections have been withdrawn.
IQVIA may be excluding too many patients based on wound severity. Its August 28 slide treats the study’s 36%, 37% and 27% figures as three levels of increasingly severe disease. But the study grouped patients by pain and ulcers: pain alone, pain with ulcers, or ulcers without pain. Having an ulcer without pain does not by itself mean the patient has the most severe tissue loss. IQVIA should check the actual clinical findings before excluding these people. Read Schraepen et al., Table 1
| Actual published group | Limbs | Share |
|---|---|---|
| Rest pain only | 225 | 36.1% |
| Ulcers with rest pain | 230 | 36.8% |
| Ulcers only | 169 | 27.1% |
What the study actually counted
In CLIPPER, 105,790 of 1,130,065 Medicare patients with CLTI (9.4%) were assigned to Rutherford 6 by a diagnosis-code algorithm. Any gangrene code triggered that category. The authors explicitly acknowledge that limited toe gangrene could therefore be labeled Rutherford 6 when clinical assessment would classify it as Rutherford 5. Read CLIPPER, including its limitations
A coding category is not a treatment decision. This figure is not a validated measure of unsalvageable limbs, extensive tissue loss or permanent ineligibility. It cannot be converted into a percentage of patients to remove from the CollateGene population.
Determine candidacy from the patient’s actual wound, perfusion, infection status, salvageability and applicable treatment criteria after appropriate care. This does not mean every patient is eligible or that trial or label restrictions can be ignored. It means the model must measure the clinical question it is trying to answer. LEGenD-1 treatment criteria · Global Vascular Guidelines
Remission requires continued care
The episode can end.
The patient remains at risk.
The Armstrong–Armstrong IWJ paper frames recurrence in a longitudinal care model comparable to cancer follow-up. It reports DFU recurrence of 42%, 58% and 65% at one, three and five years, respectively. Its 50.1% three-year CLTI figure is endovascular reintervention, a different endpoint. Read the IWJ 2025 manuscript · BEST-CLI reintervention analysis
DFU recurrence after healing
Armstrong NS, Armstrong AA, et al. · IWJ 2025 ↗A different endpoint50.1%CLTI reintervention
at 3 years
After endovascular treatment, as cited in the IWJ analysis.
Reintervention is distinct from DFU recurrence and gene-therapy eligibility.Read the manuscript ↗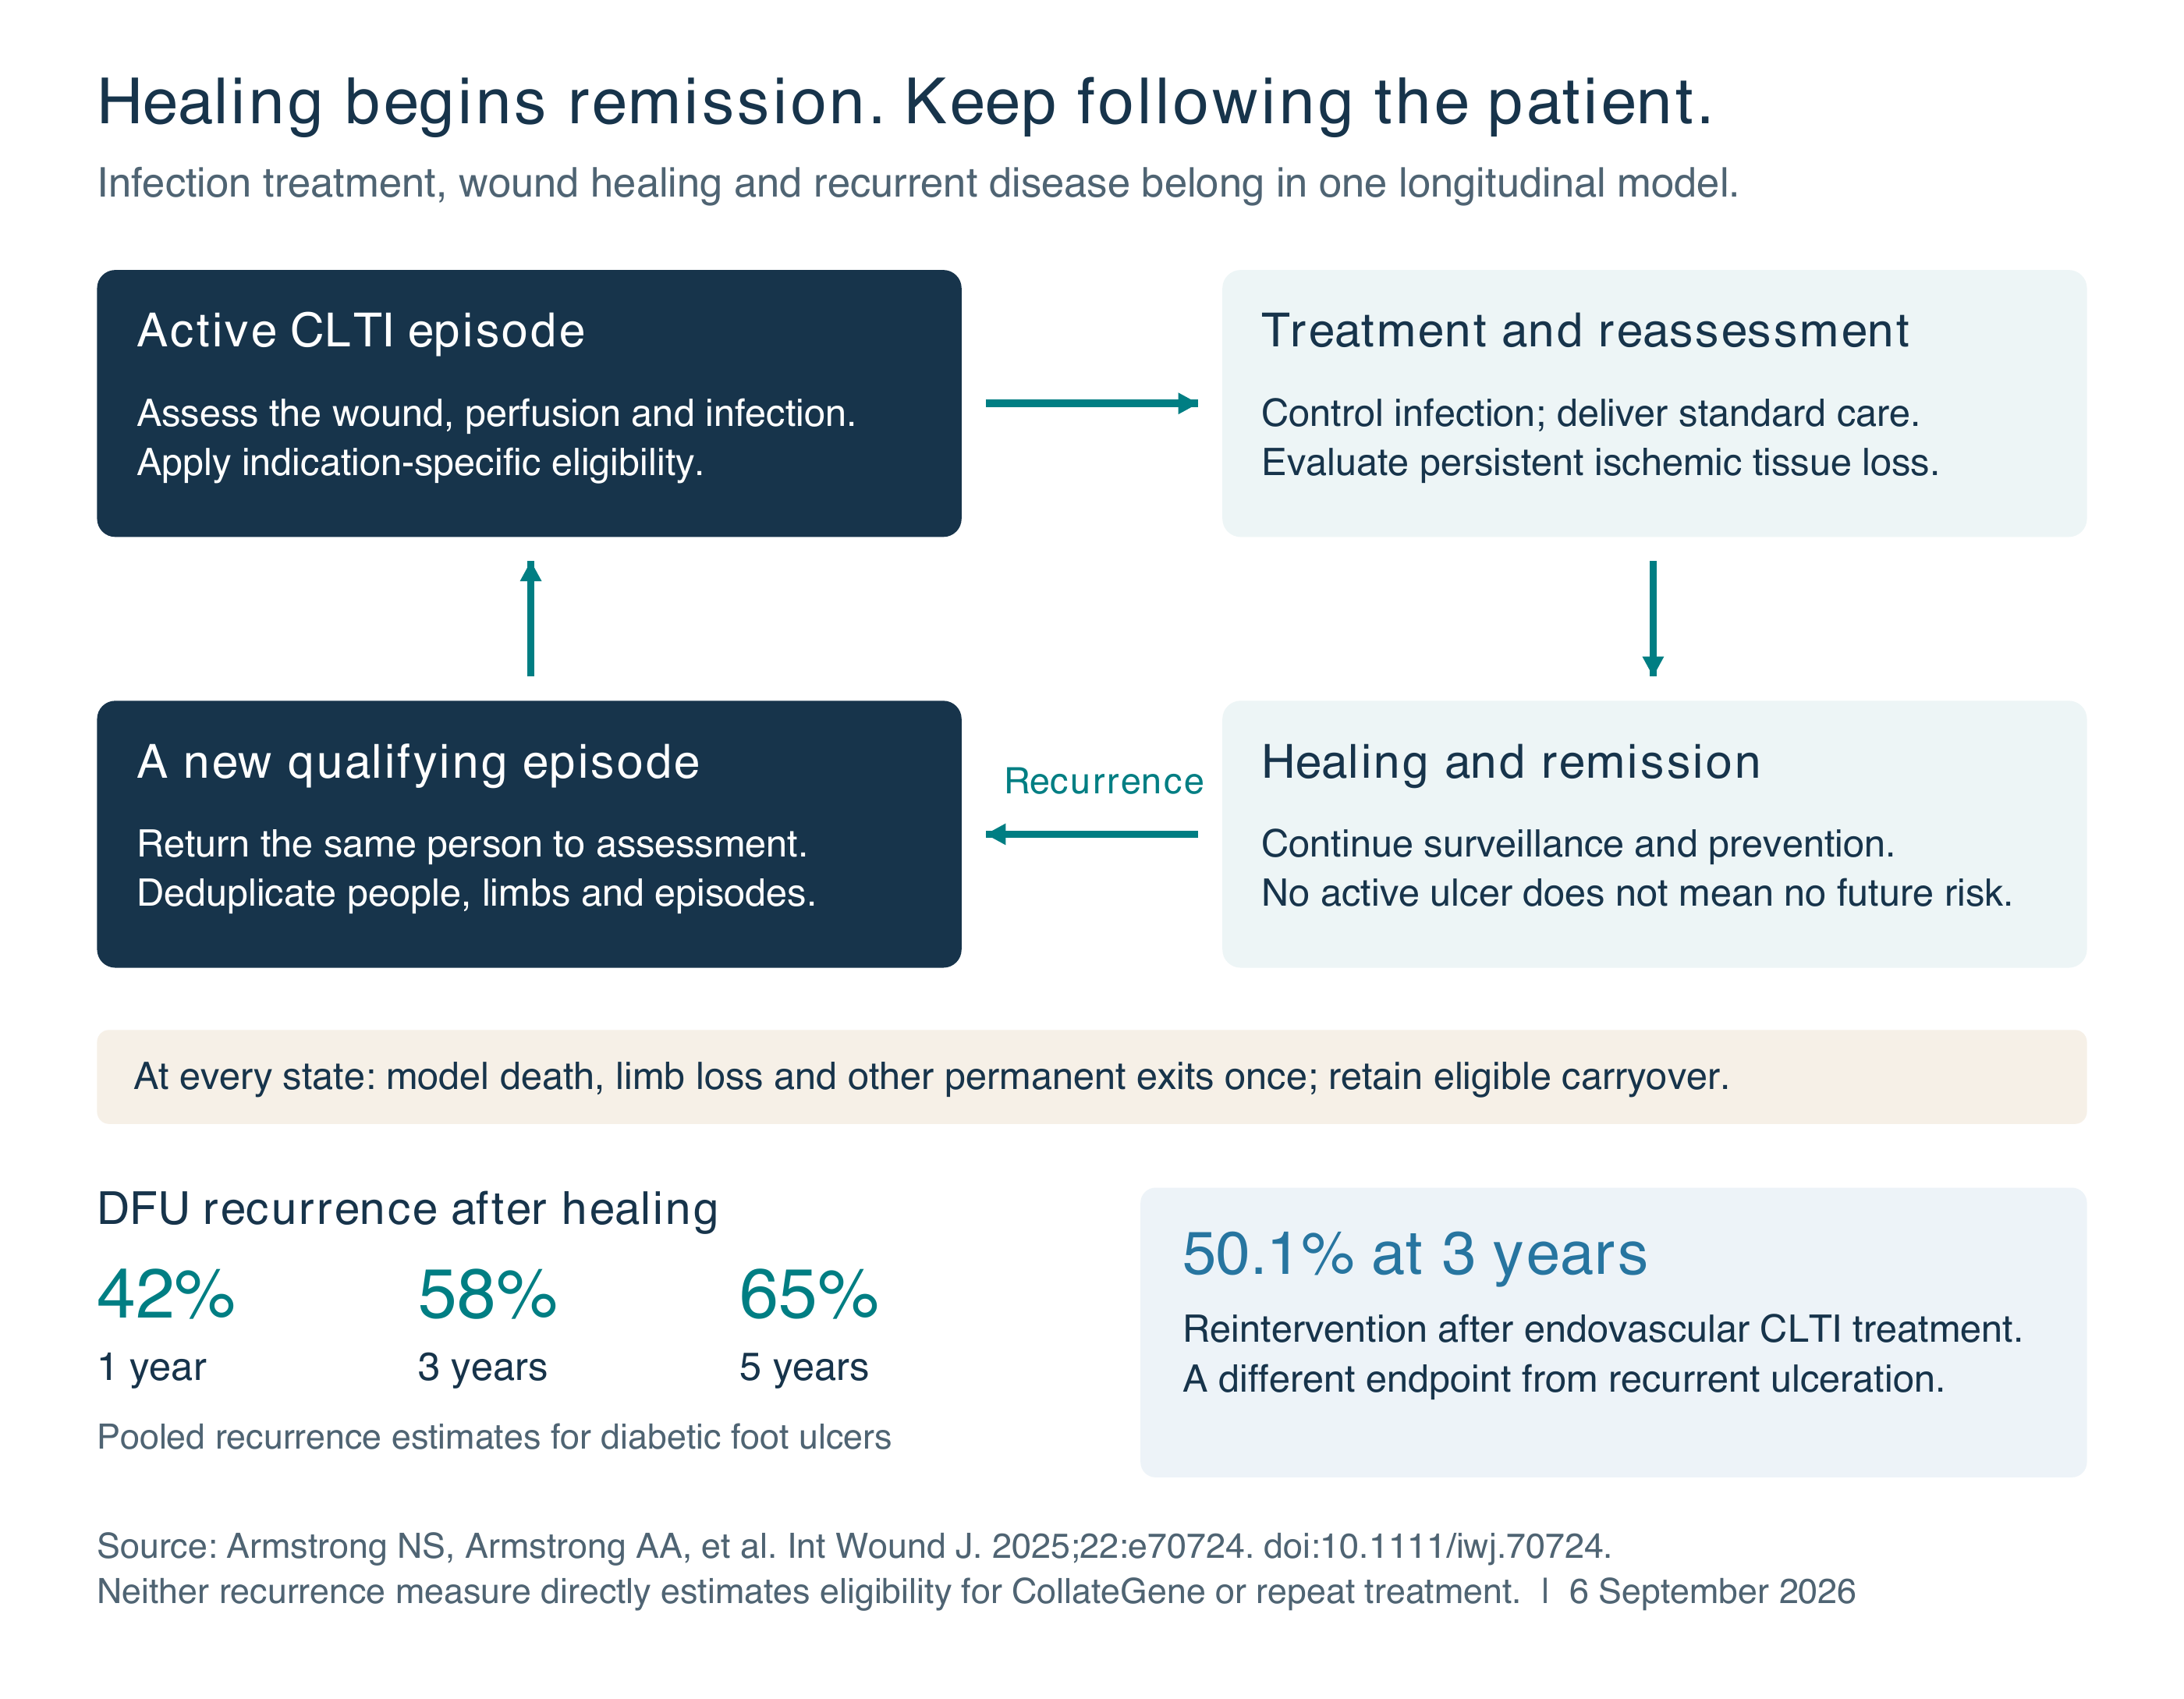
Keep the clinical evidence tied to its population.
LEGenD-1 studied 75 participants with neuroischemic ulcers and defined perfusion criteria. Median healing time was 84 versus 280 days, and 12-month healing was 77.6% versus 46.2%. The six-month comparison was 63.3% versus 38.5% (P=0.053). These results support further development in the studied population; they do not establish efficacy across all CLTI. Published LEGenD-1 study
The registry required an uninfected, nongangrenous ulcer at randomization. An infection history therefore calls for reassessment against all criteria. A broad future-label forecast and a trial-like ulcer forecast should be shown separately. Trial eligibility criteria
Materials for review and discussion
Use the report. Share the evidence.
Prevalence waterfall slide
Editable five-step discussion scenario. Asterisks identify the provisional 9.4% eligibility deduction and all dependent numbers.
Download PowerPoint · View slide and calculationsIllustrated population review
Population range revision · 8 September 2026. Carries the separately cited 1.0M and 2.0M CLTI benchmarks and an illustrative 1.5M midpoint through assessment and infection scenarios. Includes Deng PAD context and clinical eligibility distinctions.
Read PDF · Download WordFigures for presentations
Updated PNG and SVG figures, including the three-column prevalence and assessment pathway.
Download both figuresPrimary papers and authoritative sources
Manuscript library
The report includes the internal model audit and full source notes. Published evidence below supports specific clinical or epidemiologic claims; no single paper validates the complete commercial forecast.
- Abu Dabrh AM, Steffen MW, Undavalli C, et al.
The natural history of untreated severe or critical limb ischemia. J Vasc Surg. 2015;62:1642–1651.e3. doi:10.1016/j.jvs.2015.07.065.13 studies, 1,527 patients without revascularization; median 12 months; all-cause mortality 22% (95% CI 12–33%), major amputation 22% (95% CI 2–42%). Low-quality evidence. - Duff S, Mafilios MS, Bhounsule P, Hasegawa JT.
The burden of critical limb ischemia: a review of recent literature. Vasc Health Risk Manag. 2019;15:187–208. doi:10.2147/VHRM.S209241.Underlying review cited by Barnes et al. for prevalence and outcomes; heterogeneous definitions and populations. - Armstrong NS, Armstrong AA, Mills JL, Conte MS, Tan TW, Swanson RS, Armstrong DG
Three-Year Recurrence in People With Diabetic Foot Ulcers and Chronic Limb Threatening Ischemia Is Comparable to Cancer. Int Wound J. 2025;22(8):e70724. Published July 22, 2025. The report distinguishes DFU recurrence from CLTI endovascular reintervention. - Barnes JA, Eid MA, Creager MA, Goodney PP
Epidemiology and Risk of Amputation in Patients With Diabetes Mellitus and Peripheral Artery Disease. Arterioscler Thromb Vasc Biol. 2020;40(8):1808–1817. doi:10.1161/ATVBAHA.120.314595.CLTI section: 1.28% of US adults over 40, approximately 2 million, citing Duff et al. 2019. Upper benchmark in the displayed range. - Callegari S, Romain G, Cleman J, et al
Long-Term Mortality Predictors Using a Machine-Learning Approach in Patients With Chronic Limb-Threatening Ischemia After Peripheral Vascular Intervention. J Am Heart Assoc. 2024;13:e034477. The million-person estimate is background epidemiology, not this study’s national estimate.Introduction: approximately 1 million US patients; background epidemiology. Lower benchmark in the displayed range. - Allison MA, Armstrong DG, Goodney PP, et al
Health Disparities in Peripheral Artery Disease: A Scientific Statement From the American Heart Association. Circulation. 2023;148(3):286–296. doi:10.1161/CIR.0000000000001153. - Nehler MR, Duval S, Diao L, et al
Epidemiology of peripheral arterial disease and critical limb ischemia in an insured national population. J Vasc Surg. 2014;60(3):686–695.e2. doi:10.1016/j.jvs.2014.03.290. - Kwong M, Rajasekar G, Utter GH, Nuño M, Mell MW
Updated estimates for the burden of chronic limb-threatening ischemia in the Medicare population. J Vasc Surg. 2023;77(6):1760–1775. doi:10.1016/j.jvs.2023.01.200. - Baser O, Verpillat P, Gabriel S, Wang L
Prevalence, Incidence, and Outcomes of Critical Limb Ischemia in the US Medicare Population. Vasc Dis Manag. 2013;10(2):E26–E36. Methods and Results distinguish the source population from 68,074 new CLI cases. - Schraepen C, van der Laan L, Smet N, Meulenbroek A, Fourneau I
Chronic Limb-Threatening Ischemia does not Enclose a Homogenous Population: Time for a More Detailed Classification. Int J Angiol. 2024;33(1):8–14. Published online December 15, 2023. Table 1. doi:10.1055/s-0043-1777414. - Fanaroff AC, Dayoub EJ, Yang L, et al
Development and Description of a National Cohort of Patients With Chronic Limb-Threatening Ischemia. J Soc Cardiovasc Angiogr Interv. 2023;2(4):100982. CLIPPER cohort; claims-based staging.Descriptive diagnosis-code cohort only. Its 9.4% Rutherford 6 category is not a validated treatment exclusion rate. - Boulton AJM, Armstrong DG, Kirsner RS, et al
Diagnosis and Management of Diabetic Foot Complications. Arlington, VA: American Diabetes Association; 2018. Management of Infection, Outcome section. doi:10.2337/db20182-1. - Pham TT, Gariani K, Richard JC, et al
Moderate to Severe Soft Tissue Diabetic Foot Infections: A Randomized, Controlled, Pilot Trial of Post-debridement Antibiotic Treatment for 10 versus 20 days. Ann Surg. 2022;276(2):233–238. doi:10.1097/SLA.0000000000005205. - Altmann D, Waibel FWA, Forgo G, et al
Timing of Revascularization and Parenteral Antibiotic Treatment Associated with Therapeutic Failures in Ischemic Diabetic Foot Infections. Antibiotics. 2023;12(4):685. doi:10.3390/antibiotics12040685. - Lipsky BA, Armstrong DG, Citron DM, et al
Ertapenem versus piperacillin/tazobactam for diabetic foot infections (SIDESTEP): prospective, randomised, controlled, double-blinded, multicentre trial. Lancet. 2005;366:1695–1703. doi:10.1016/S0140-6736(05)67694-5. - Pachon Burgos A, et al
Risk factors associated with amputations in patients with diabetic foot infection. Seven years of experience in a reference hospital in Panama. The diabetic foot study group at Chiriqui (the FOOTCHI study group). Endocrine and Metabolic Science. 2024;16:100184. - Conte MS, Bradbury AW, Kolh P, et al
Global vascular guidelines on the management of chronic limb-threatening ischemia. Eur J Vasc Endovasc Surg. 2019;58(1S):S1–S109.e33. Recommendations 6.6–6.8 support integrated staging and reassessment after infection procedures. - Senneville E, Albalawi Z, van Asten SA, et al
IWGDF/IDSA guidelines on the diagnosis and treatment of diabetes-related foot infections. Diabetes Metab Res Rev. 2024;40(3):e3687. Guideline labeled IWGDF/IDSA 2023. - Armstrong DG, Conte MS, Mills JL, et al
Anatomically Directed Lower Extremity Gene Therapy for Ulcer Healing: A Double-Blind, Randomized, Placebo-Controlled Study (LEGenD-1). Circ Cardiovasc Interv. 2026;19:e015648. Published online November 4, 2025. - ClinicalTrials.gov
NCT04267640. Study of AMG0001 to Improve Ulcer Healing and Perfusion in Subjects With Peripheral Ischemic Ulcers. Eligibility criteria read September 6, 2026, including absence of infection or gangrene at randomization, wound size and perfusion restrictions. - Armstrong DG, Boulton AJM, Bus SA
Diabetic Foot Ulcers and Their Recurrence. N Engl J Med. 2017;376:2367–2375. Background for recurrent wound episodes and the distinction between healing and ongoing disease risk; not used to calculate CollateGene-treated patients. - Conte MS, Azene E, Doros G, et al
Secondary interventions following open vs endovascular revascularization for chronic limb threatening ischemia in the BEST-CLI trial. J Vasc Surg. 2024;79(6):1428–1437.e4. Primary reintervention analysis cited by the IWJ paper. - Deng L, Du C, Liu L, et al
Forecasting the Global Burden of Peripheral Artery Disease from 2021 to 2050: A Population-Based Study. Research. 2025;8:0702. Used for the direction of PAD burden and the need for explicit temporal assumptions, not as a US CLTI multiplier.Table 1: 16.41M PAD cases in high-income North America in 2021 (95% UI 14.68–18.34M), projected 31.08M in 2050. Regional PAD context only. - Mustapha JA, Katzen BT, Neville RF, et al
Disease Burden and Clinical Outcomes Following Initial Diagnosis of Critical Limb Ischemia in the Medicare Population. JACC Cardiovasc Interv. 2018;11(10):1011–1012. The 0.22% extraction shown in this review is explicitly attributed to the circulated IQVIA table and requires workbook reconciliation.